The growing share of solar in the electricity supply mix has introduced a new trend in hourly wholesale electricity prices. In the afternoons, especially during the low-demand spring months, prices often drop sharply — sometimes even turning negative. This phenomenon first appeared in U.S. markets like CAISO and later spread to European markets such as Germany, Spain, and the Netherlands. As renewable penetration continues to rise, more markets are experiencing similar patterns. Hungary is among those markets with the rapid growth of solar in its electricity mix.
Hourly day-ahead prices in spring 2025 have shown a much stronger “duck curve” effect compared to 2023 and 2024. Figures 1 and 2 highlight larger average price spreads for March and April 2025. Increased solar generation has driven down afternoon prices, while higher commodity costs have elevated morning and evening peak prices. As a result, Hungary has joined the group of countries exhibiting more pronounced “duck-shaped” price curves.
Figure 1. Average Hourly Day-Ahead Power Prices in March in Hungary
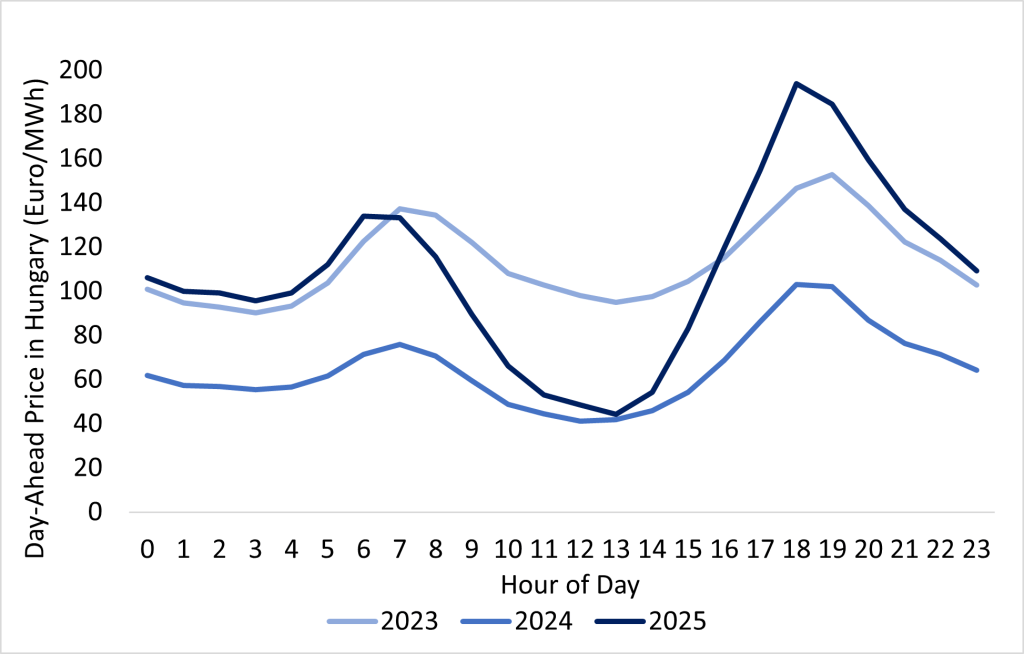
Source: ENTSO-E, 2025.
Solar generation is expected to remain strong in the near term. As a result, price shapes — particularly in the spring months — are likely to stay “ducky” unless gas prices fall and sufficient storage capacity is deployed to absorb the spreads.
Figure 2. Average Hourly Day-Ahead Power Prices in April in Hungary
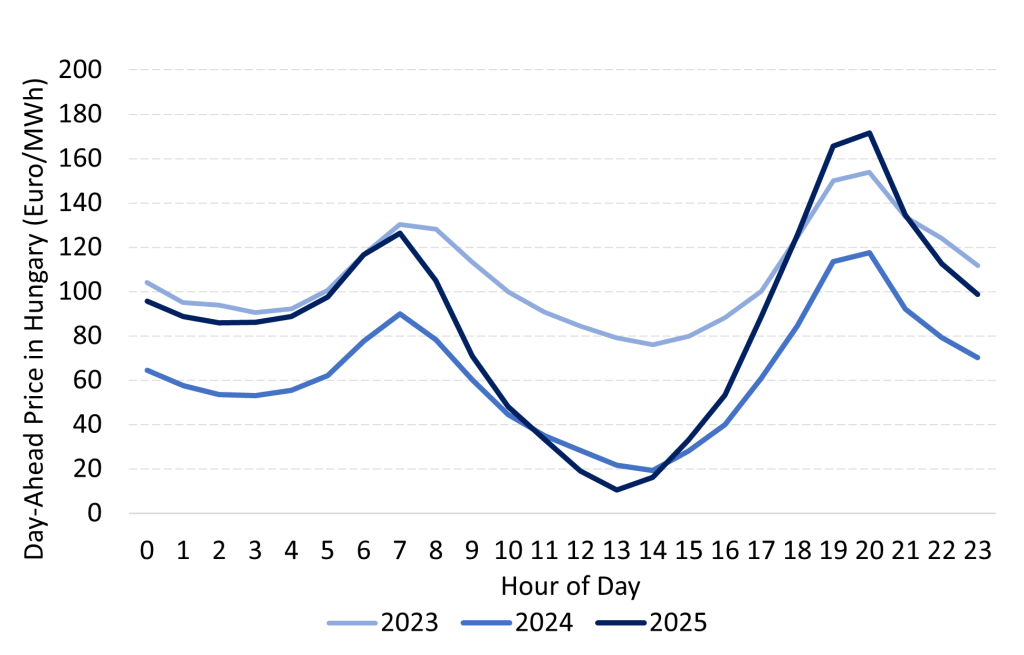
Source: ENTSO-E, 2025. 2025 prices are through April 29.
Focusing on the generation mix, Figures 3 and 4 illustrate how solar has recently become one of the primary sources of electricity. In some summer months, solar can account for around 35% of the electricity mix. At times, solar generation will be sufficient to meet the country’s power demand during low-demand hours, leading to duck-shaped price patterns, grid management challenges, and new opportunities for flexible resources.
Figure 3. Monthly Electricity Generation in Hungary
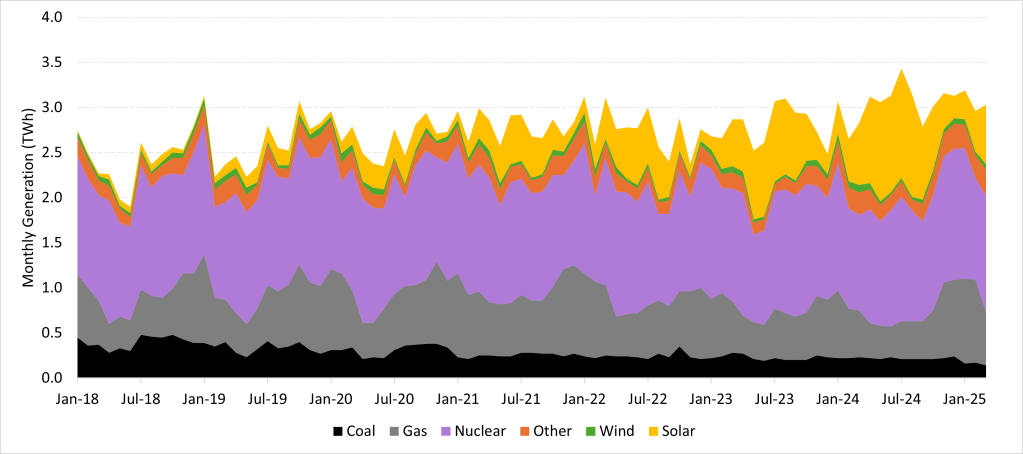
Source: Ember, 2025.
Figure 4. Share of Solar in Monthly Electricity Generation in Hungary

Source: Ember, 2025.
Figure 5 highlights the increasing share of solar in the electricity mix during April. Figure 5 highlights the increasing share of solar in the electricity mix during April.
Figure 5. Share of Solar in April
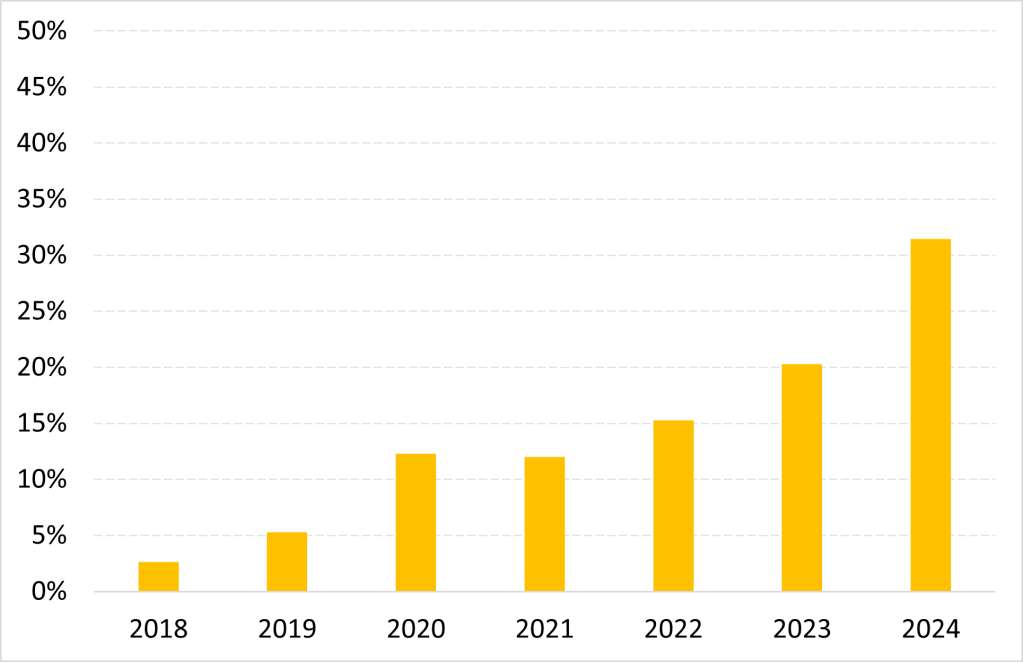
Source: Ember, 2025.
Compared with some markets such as CAISO, ERCOT, Great Britain, and Australia; battery storage has lagged in most European countries, despite many of them are solar champions. Without significant investment in storage, duck-shaped price patterns are inevitable, as solar generation is unlikely to decline in the near future. While lower gas prices could help narrow some of the price spread, they will have little impact on price during the low-demand afternoon hours. As a result, battery storage is expected to remain a critical segment of power markets going forward.
References:
Ember (2025). Electricity Data Explorer | Ember
ENTSO-E (2025). ENTSO-E Transparency Platform

Leave a comment