The growing share of solar has brought ducky power price shapes where wholesale prices are lower and even negative especially during spring afternoons when the demand is low and solar generation is high. This particular shape took interest first in CAISO and now it is common in many European power markets. Most of such European markets are the markets with increasing share of solar in their electricity mix. some examples are Germany, Spain, and the Netherlands. However, we observe that not only the markets with high solar share but also other markets with limited solar share can have ducky price shapes as the markets are interconnected. Finland is such an example.
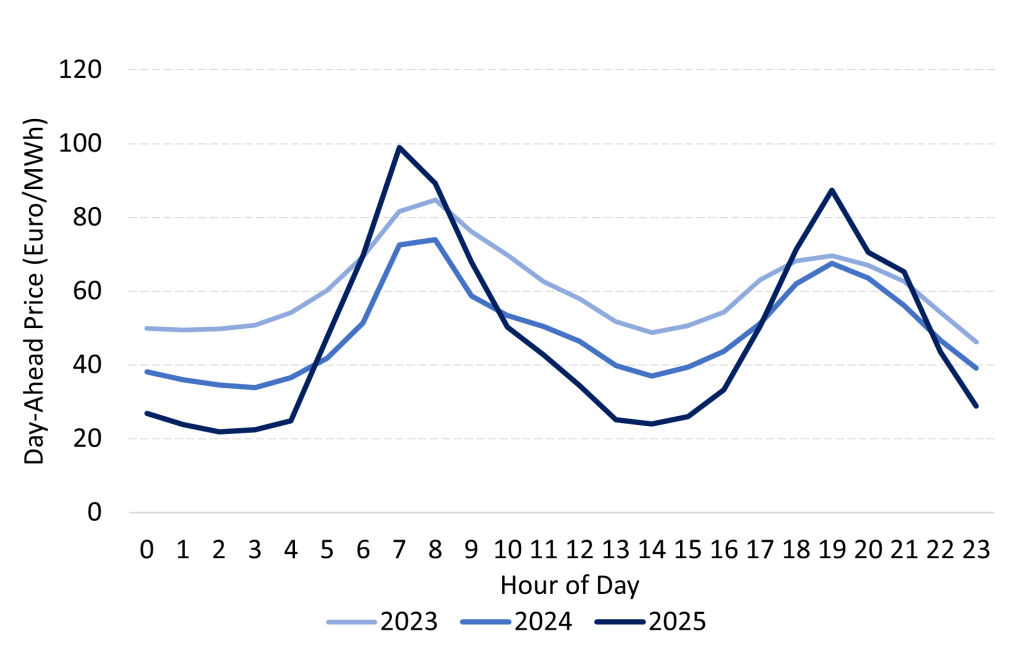
In spring 2025, Finland’s hourly day-ahead electricity prices exhibit a more pronounced “duck curve” pattern than in the same months of 2023 and 2024. As shown in Figures 1 and 2, the average price spreads for March and April 2025 have widened. Unlike in many other countries, this afternoon price dip is not driven by domestic solar generation as solar still accounts for a relatively small portion of Finland’s power mix.
Figure 1. Average Hourly Day-Ahead Power Prices in March in Finland

Source: ENTSO-E, 2025.
Figure 2. Average Hourly Day-Ahead Power Prices in April in Finland
Source: ENTSO-E, 2025.
Is it due to lower demand during those hours? Figures 3 and 4 suggest otherwise—load levels show only a limited decline during midday compared to other hours, and in some months, they are even higher. This indicates that demand alone cannot account for the lower daytime prices.
Figure 3. Average Hourly Load in March in Finland
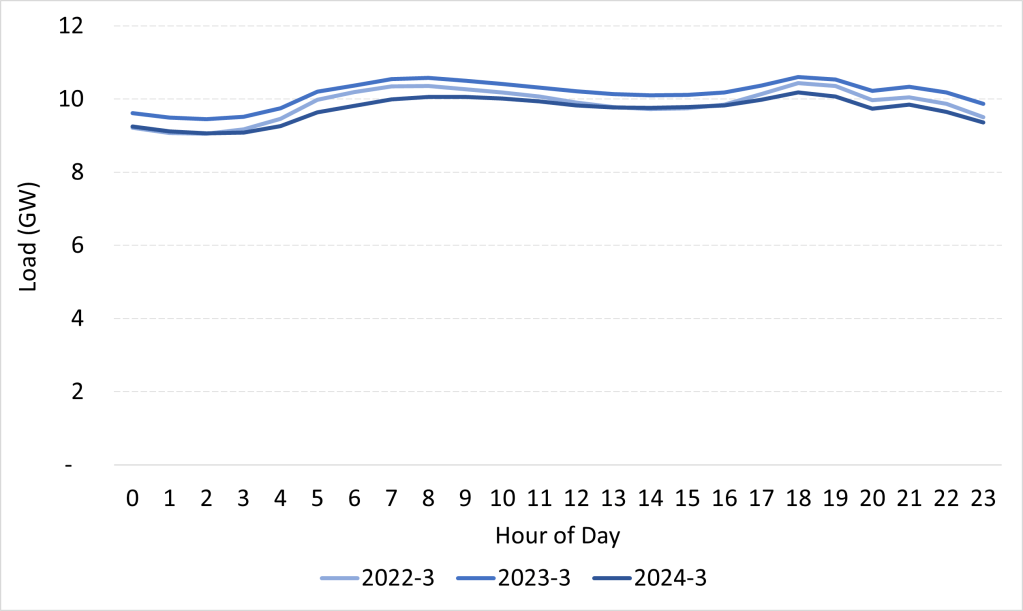
Source: ENTSO-E, 2025.
Figure 4. Average Hourly Load in April in Finland
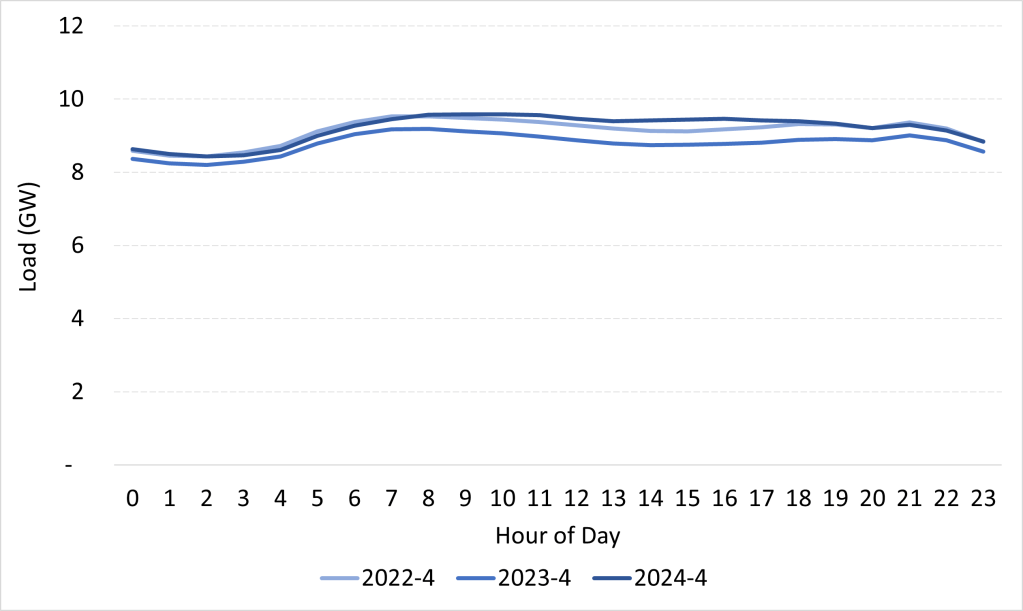
Source: ENTSO-E, 2025.
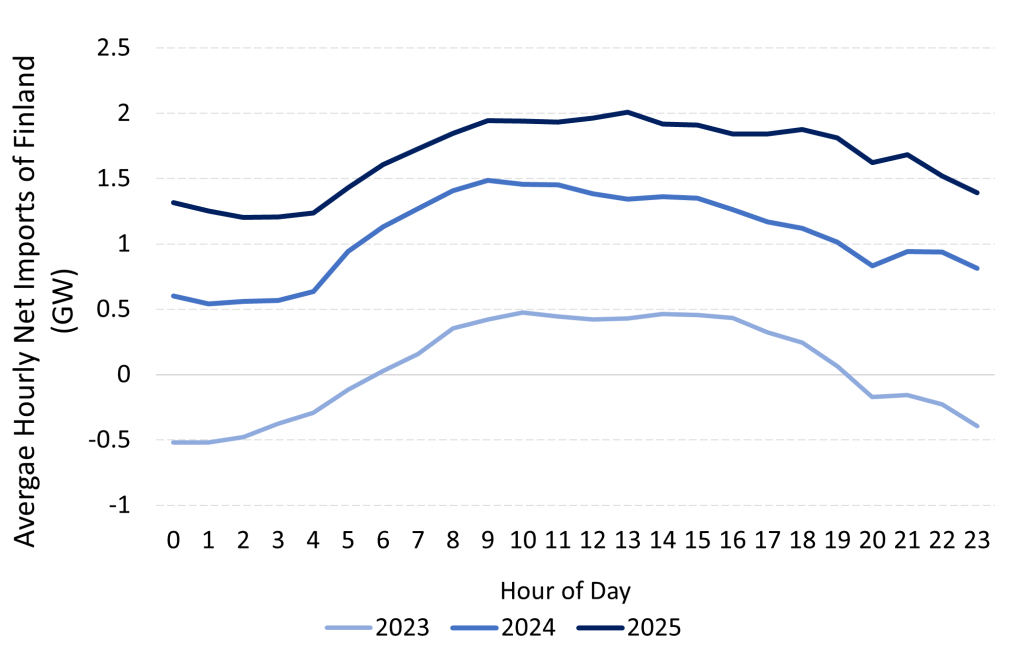
As part of the integrated European power market, Finland effectively “imports” duck-shaped price patterns by importing low-cost solar electricity from other countries. Figures 5 and 6 reveal that net electricity imports peak during midday solar hours. In April 2025, imports accounted for over 20% of Finland’s total power demand during these hours. Thus, despite having limited domestic solar generation, Finland experiences lower afternoon prices driven by the solar boom across Europe.
Figure 5. Average Hourly Net Import of Finland in March
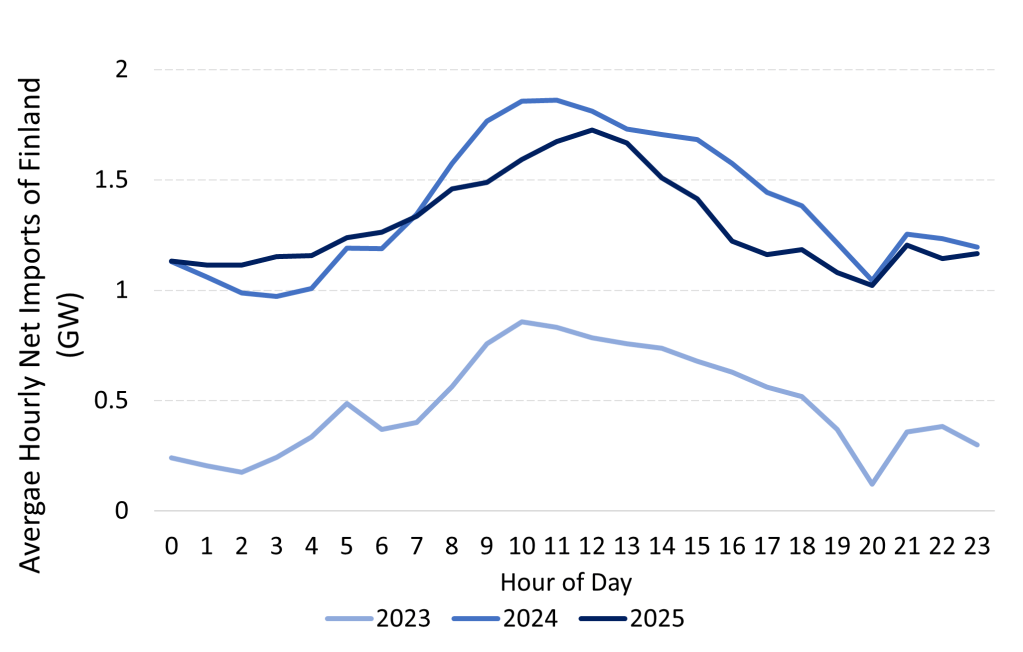
Source: ENTSO-E, 2025.
Figure 6. Average Hourly Net Import of Finland in April
Source: ENTSO-E, 2025.
Even with limited domestic solar capacity, price volatility is becoming unavoidable in an interconnected power system—especially when other countries experience a surge in solar generation. inland is already encountering this effect. The impact is likely to grow over time due to rising solar deployment across Europe, expanding cross-border transmission capacity, increasing domestic solar uptake, and delayed investment in battery storage. Countries like Finland, with low solar penetration and a large share of inflexible nuclear generation, will increasingly need flexible resources. Therefore, investment in energy storage will be essential—not only for ancillary services but also to provide the flexibility required to balance the system.
References:
Source: ENTSO-E, 2025.ENTSO-E (2025). ENTSO-E Transparency Platform

Leave a comment